
9 Useful Chrome DevTools Features You Might Be Missing
A practical overview of lesser-known DevTools tricks that improve debugging, accessibility, and performance workflows.

Developers use Chrome DevTools almost every day, but the toolset is so extensive that many features remain unnoticed. In this short overview, we’ll explore several DevTools capabilities that are genuinely useful in real-world work and often overlooked.
Maybe you already use some of them daily — or maybe these are exactly the features that will fill long-standing gaps in your debugging workflow.
Let’s get started.
Understanding Accessibility with DevTools
Large companies often have dedicated accessibility teams, but smaller teams or solo developers still want to deliver accessible products. Chrome DevTools provides helpful tools for that.
1 Simulating Vision Deficiencies
DevTools can simulate visual impairments to show how users with different vision conditions see your UI:
Path: DevTools → Rendering → Emulate vision deficiencies
Available simulations include:
Blurred Vision
Reduced Contrast Sensitivity
Protanopia (no red)
Deuteranopia (no green)
Tritanopia (no blue)
Achromatopsia (no color)
This is extremely helpful for testing visual UX beyond contrast ratios.
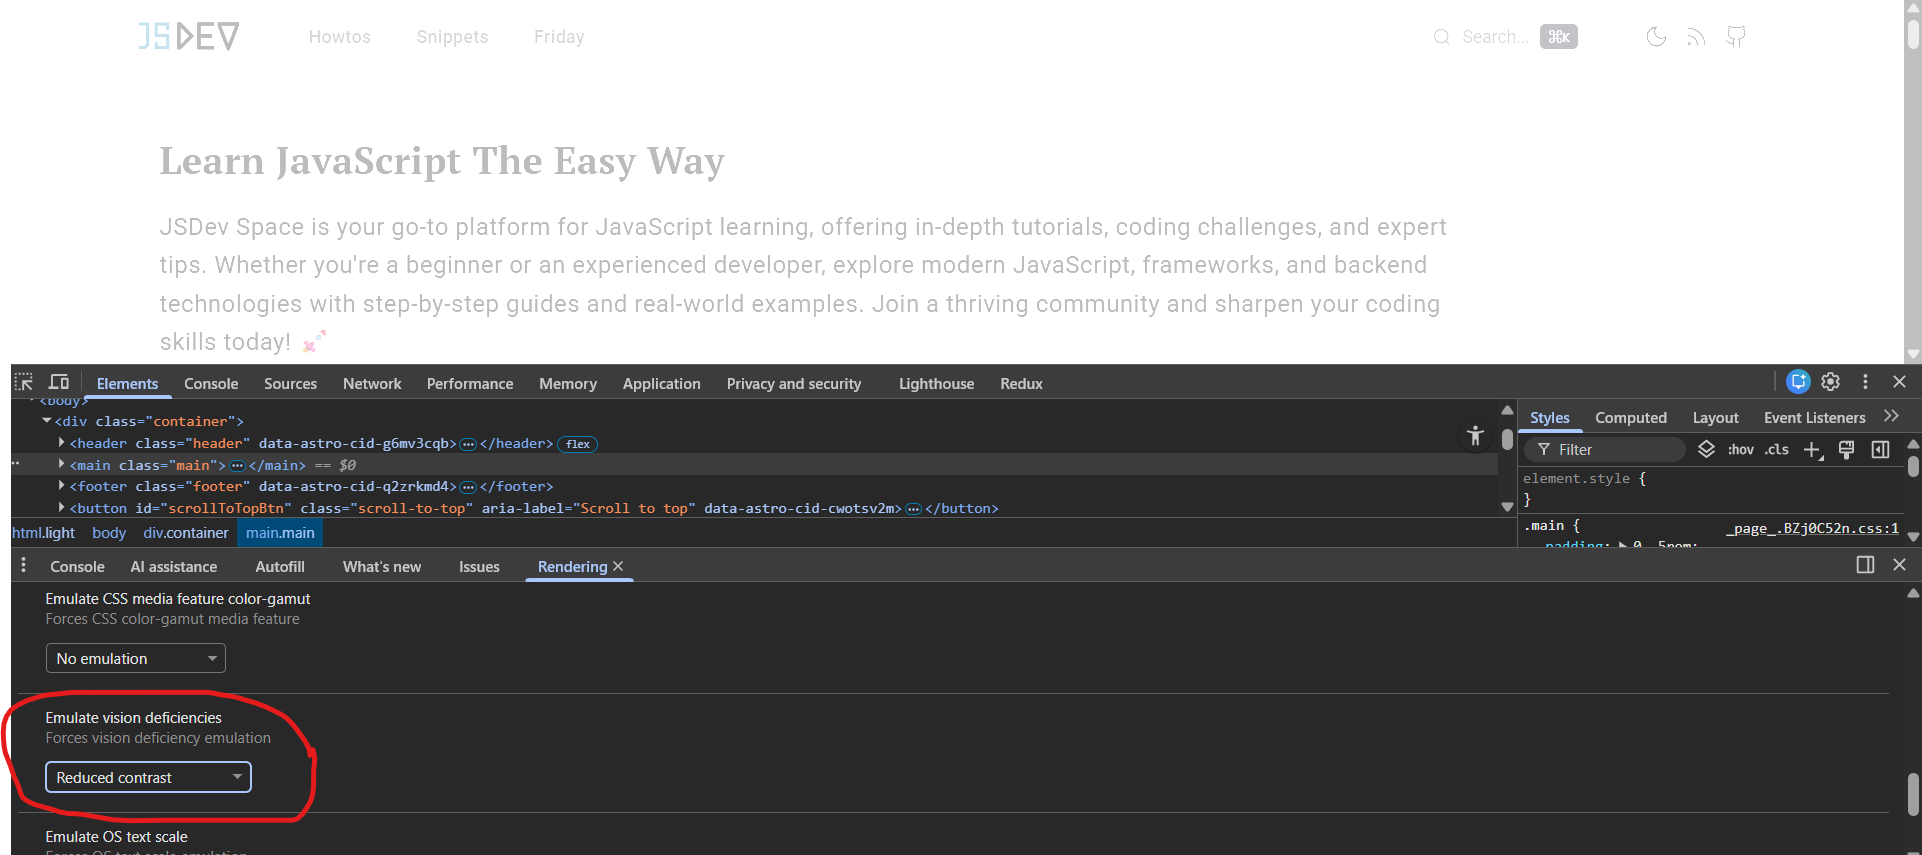
If you don’t see the Emulate vision deficiencies option, open the Command Menu with Ctrl+Shift+P, type “Rendering”, select “Show Rendering”, and the panel will appear at the bottom of DevTools.
2 Accessibility in Inspect Element
Open DevTools, pick an element, and look beyond layout metrics like margin, width, or font-style. Chrome DevTools also exposes useful accessibility‑related information.
Contrast: text contrast ratio
One of the most common accessibility issues on the web is insufficient text contrast. Chrome no longer shows contrast in the Accessibility panel — instead, you’ll find it inside the color picker:
Styles → color → click the color square → Contrast ratio
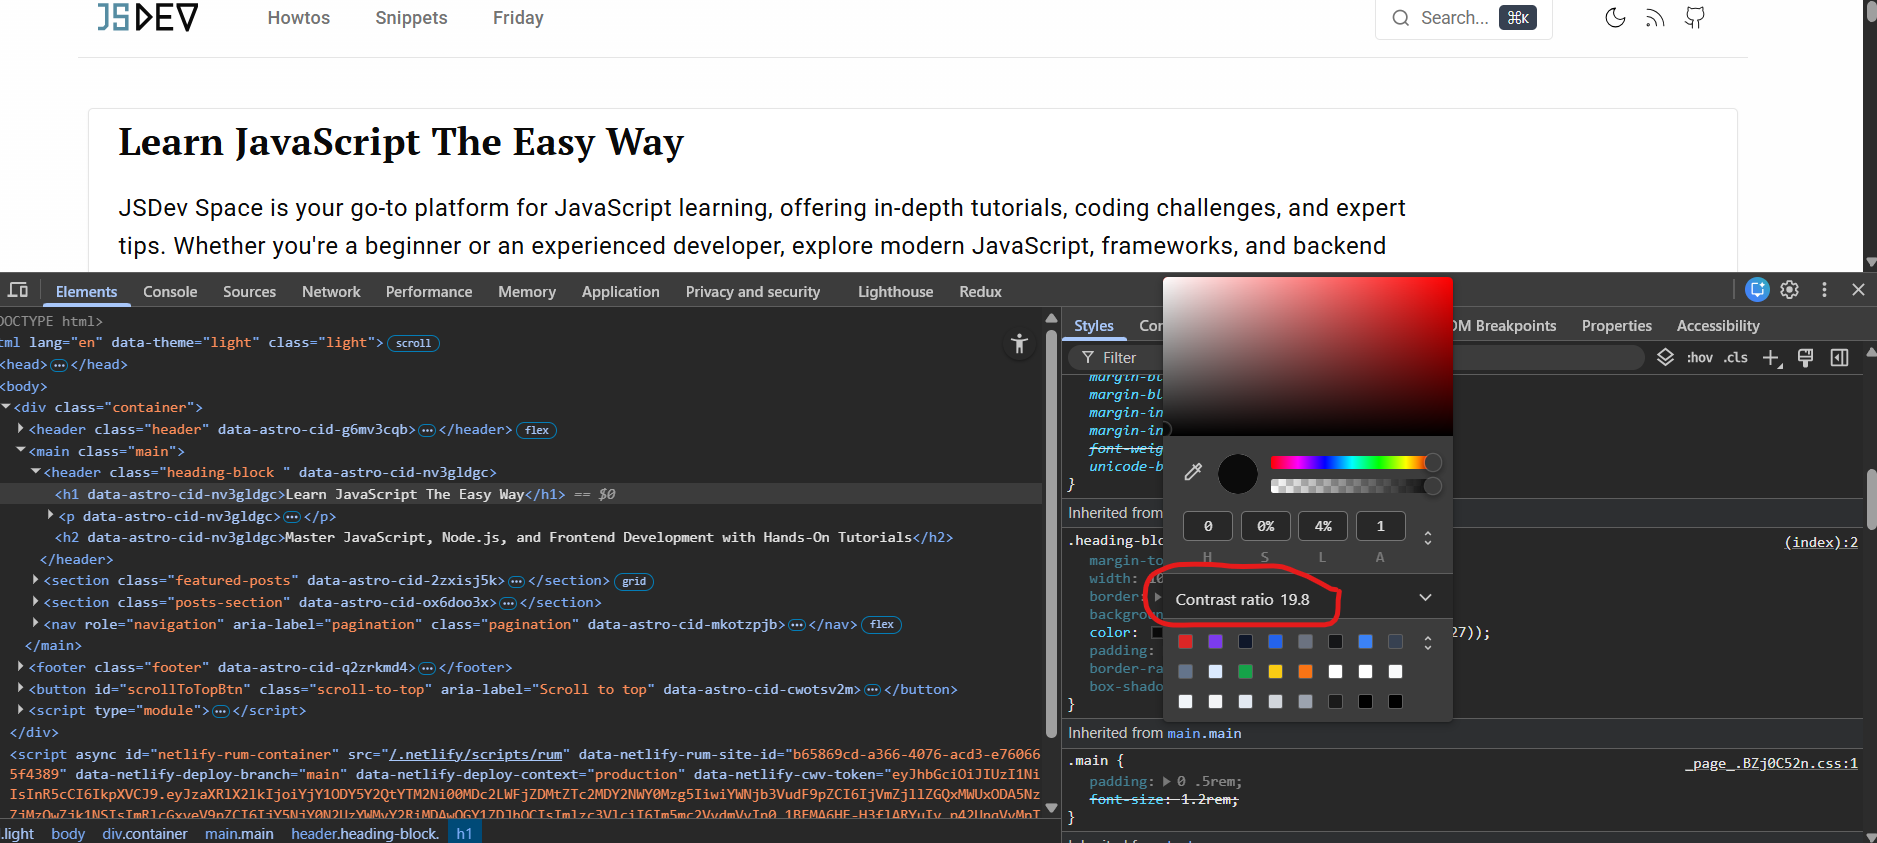
Google provides guidance on how to detect and fix contrast problems, along with recommended minimum values: 3.0 (minimum) and 4.5 (recommended).
DevTools can also display contrast using the newer APCA algorithm. To enable it:
Settings → Experiments → Enable new Advanced Perceptual Contrast Algorithm (APCA)
These built‑in tools make it easier to validate essential accessibility properties without relying on external tooling.
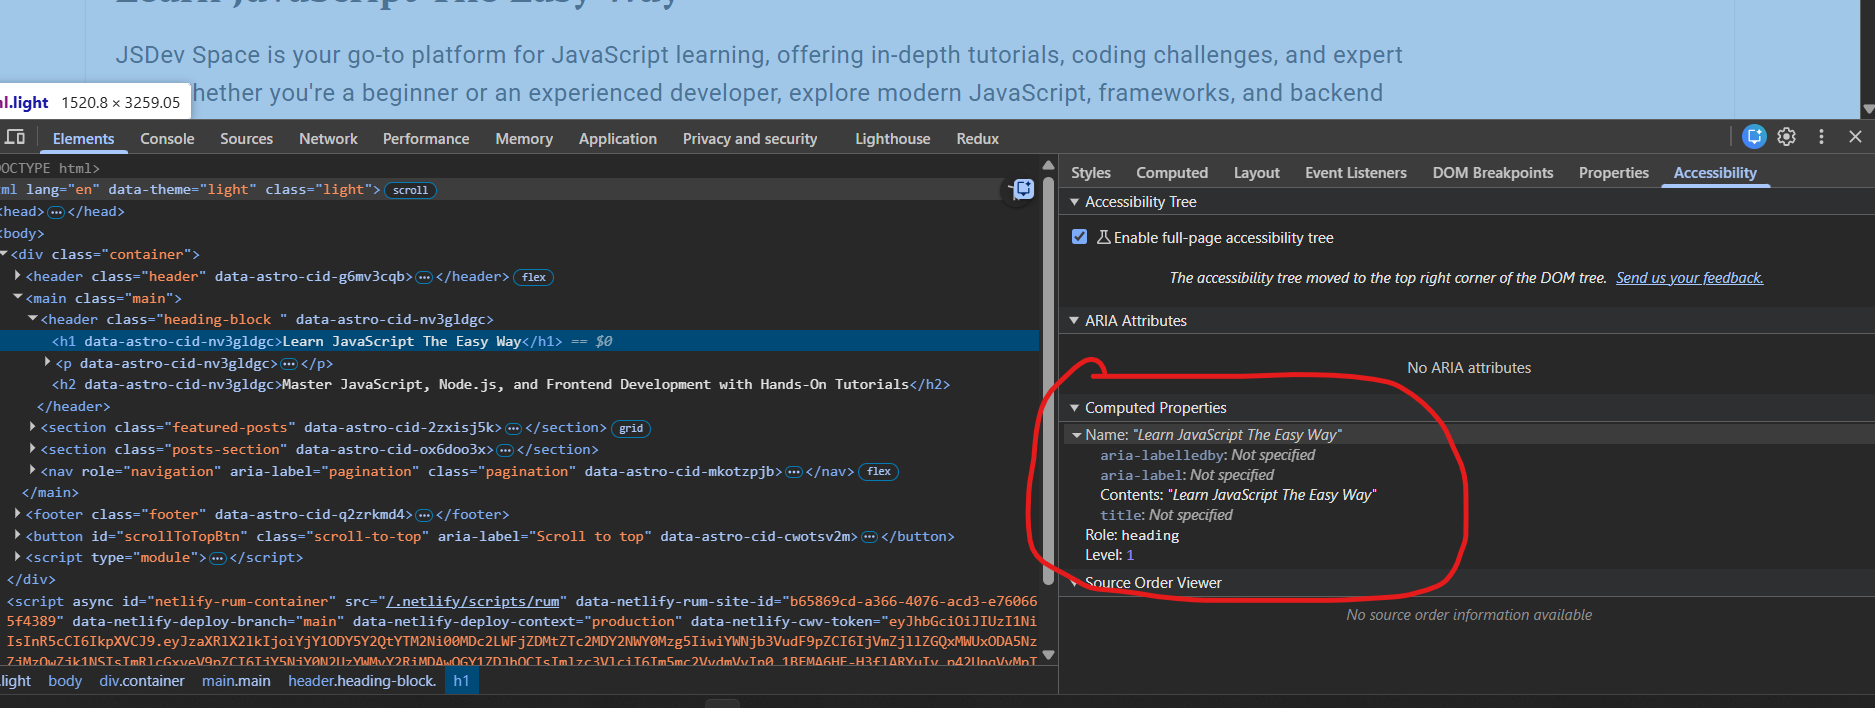
3 Accessibility Tree
On the right panel, there is an Accessibility tab. Selecting an element in the DOM shows:
how it appears in the accessibility tree, and
which semantic attributes are relevant (
aria-*, roles, content).
DevTools also offers a full accessibility tree, showing how a screen reader perceives the page. This makes it dramatically easier to audit semantic correctness.
To enable it:
Enable Accessibility Tree
Reload DevTools
Click the accessibility icon
You will see only semantically relevant nodes, not every DOM element.
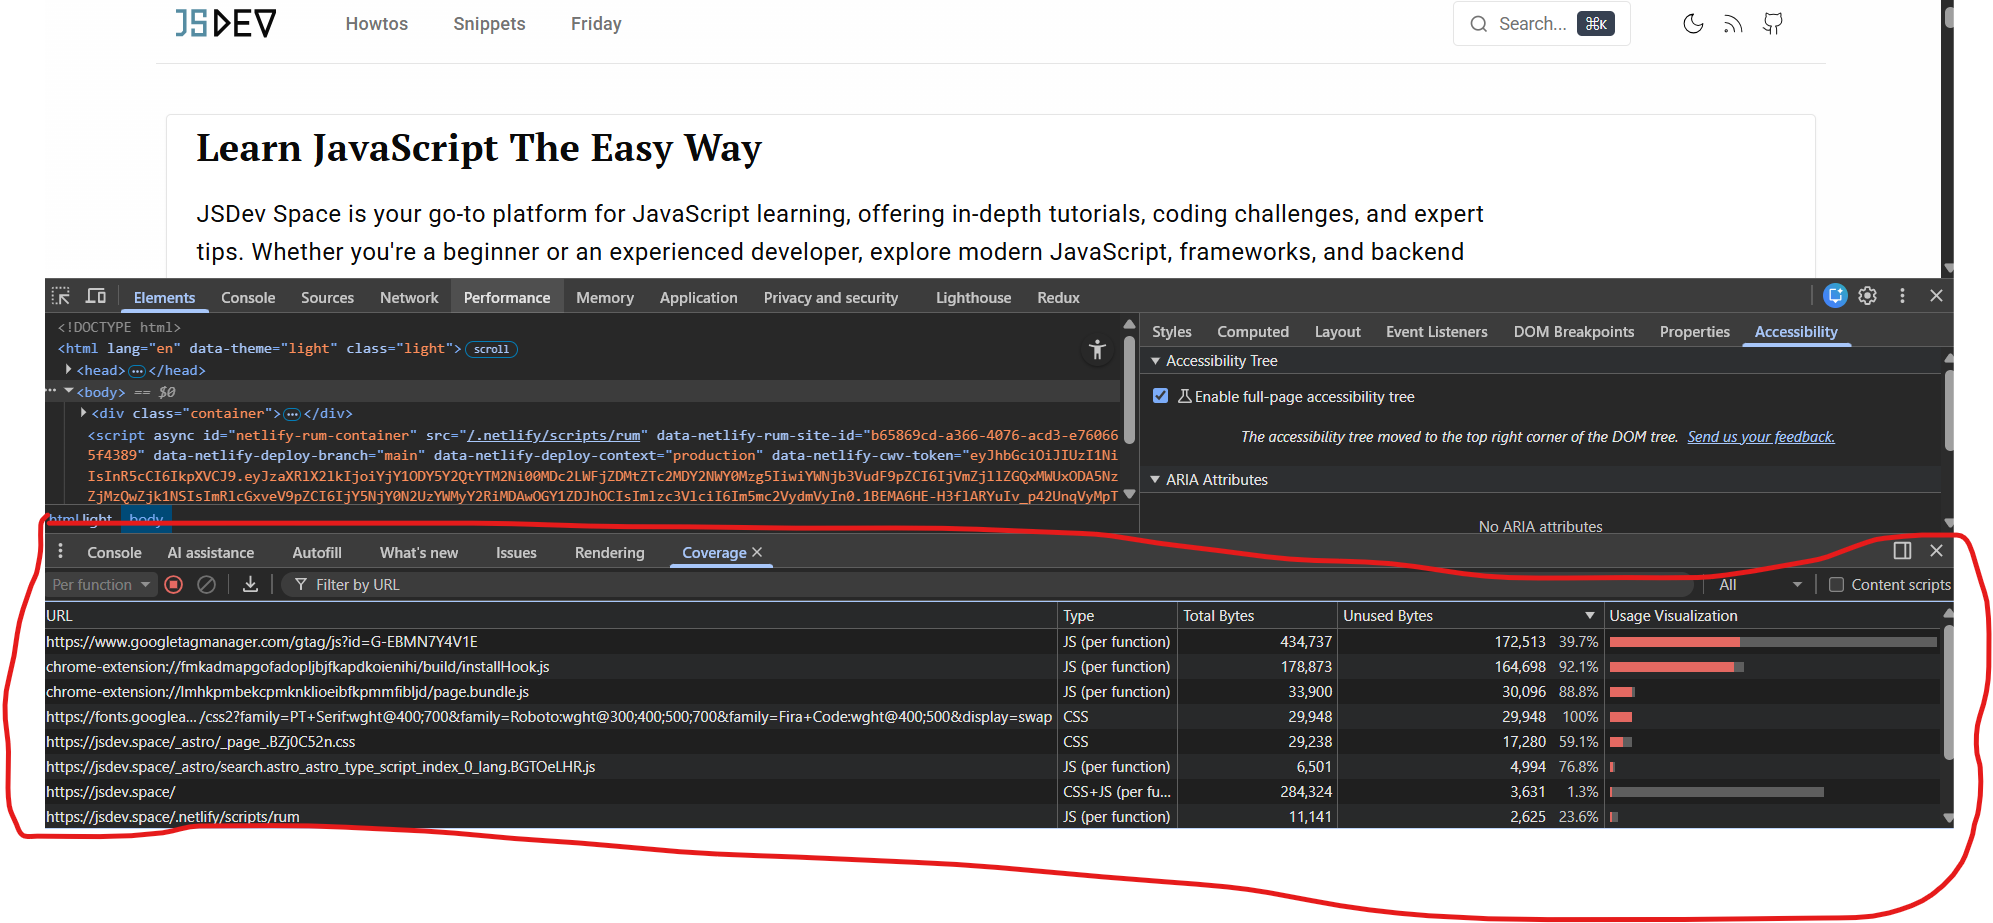
4 Code Coverage for JS + CSS
Coverage shows which parts of your JS and CSS are actually used.
Open via:
DevTools → Cmd/Ctrl + Shift + P → “Show Coverage” → Record
You will see:
Unused Bytes
File URL
Type (JS/CSS)
Inside a file, unused code is highlighted in red, used in green. This helps when:
optimizing bundle size
removing legacy code
evaluating library usage
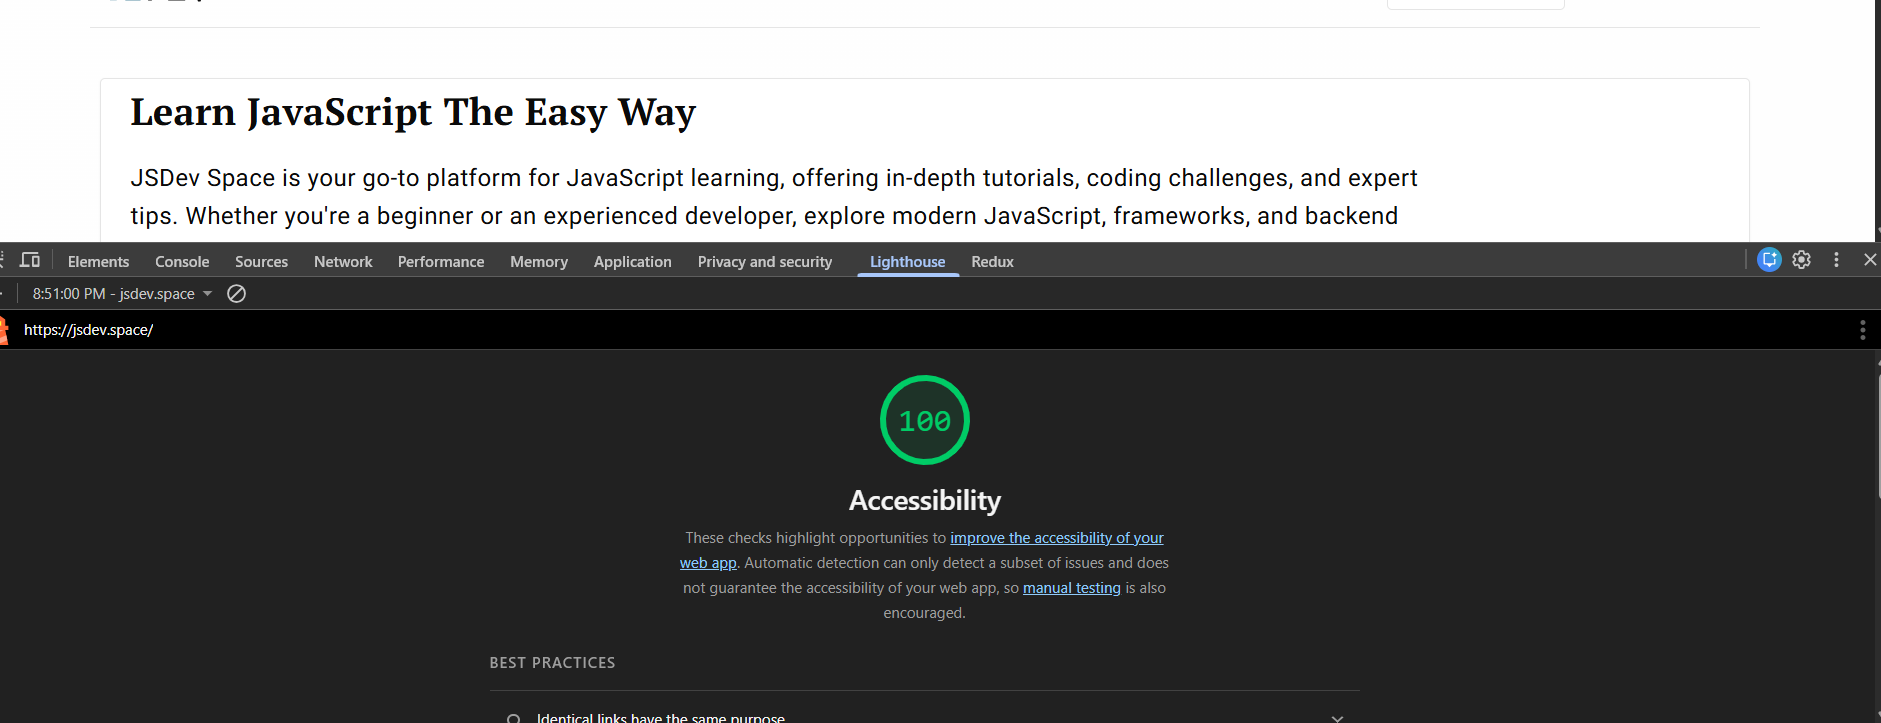
5 Lighthouse Accessibility Audit
Lighthouse can run an automated accessibility audit:
Open Lighthouse
Pick Mode and Device
Select only Accessibility
Click Analyze page load
You will receive:
an accessibility score (0–100)
actionable recommendations
Note: Lighthouse does not guarantee full accessibility compliance — it checks only measurable criteria. Manual testing is still required.
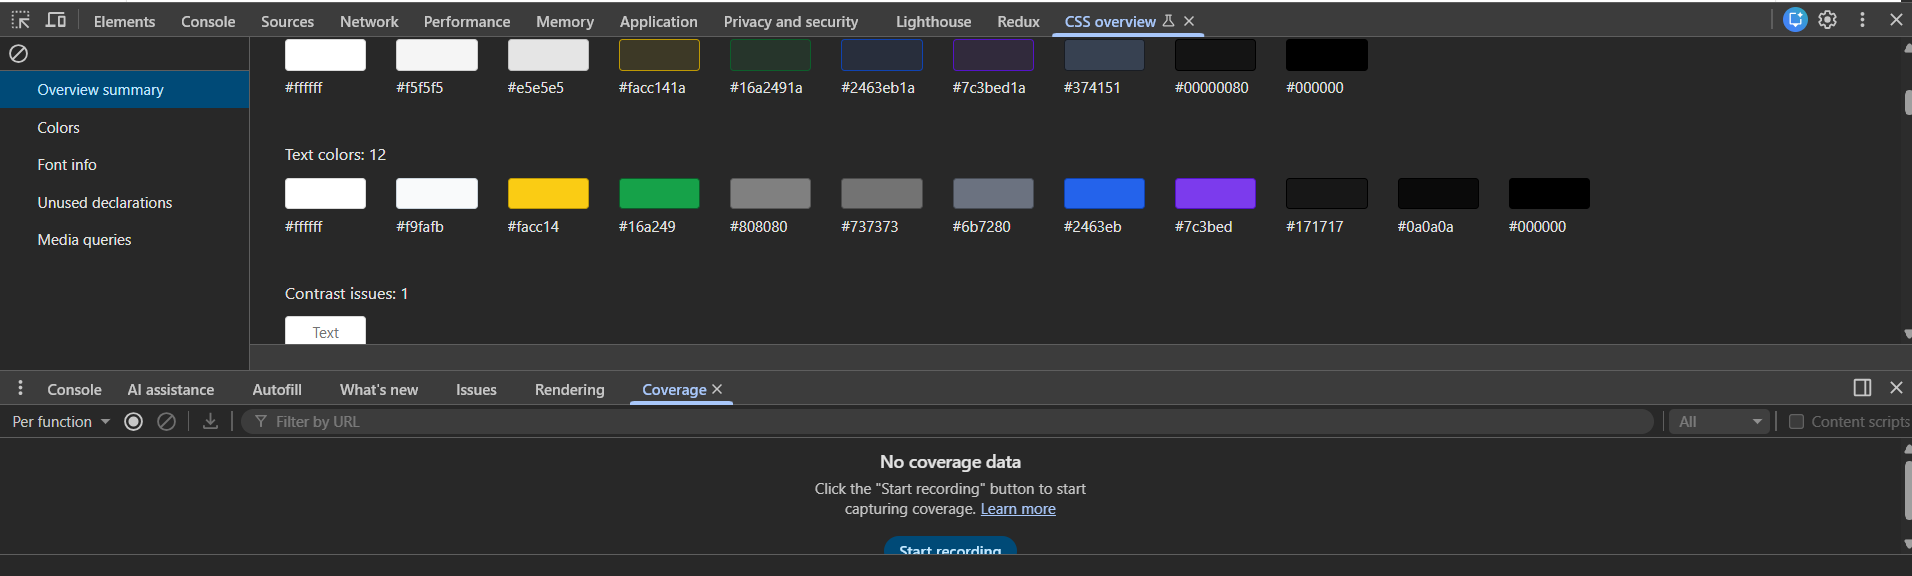
6 CSS Overview
CSS Overview provides a global snapshot of CSS usage:
It reports:
all colors used in text, backgrounds, borders
contrast issues
font sizes & line-heights
media queries
Open via:
Cmd/Ctrl + Shift + P → “Capture Overview” → Record
Very useful for cleanup and design audits.
Console Tricks
The Console is packed with hidden gems. Here are three highly practical ones.
7 Edit the Whole Page Live
Entering:
document.designMode = "on"makes all elements editable.
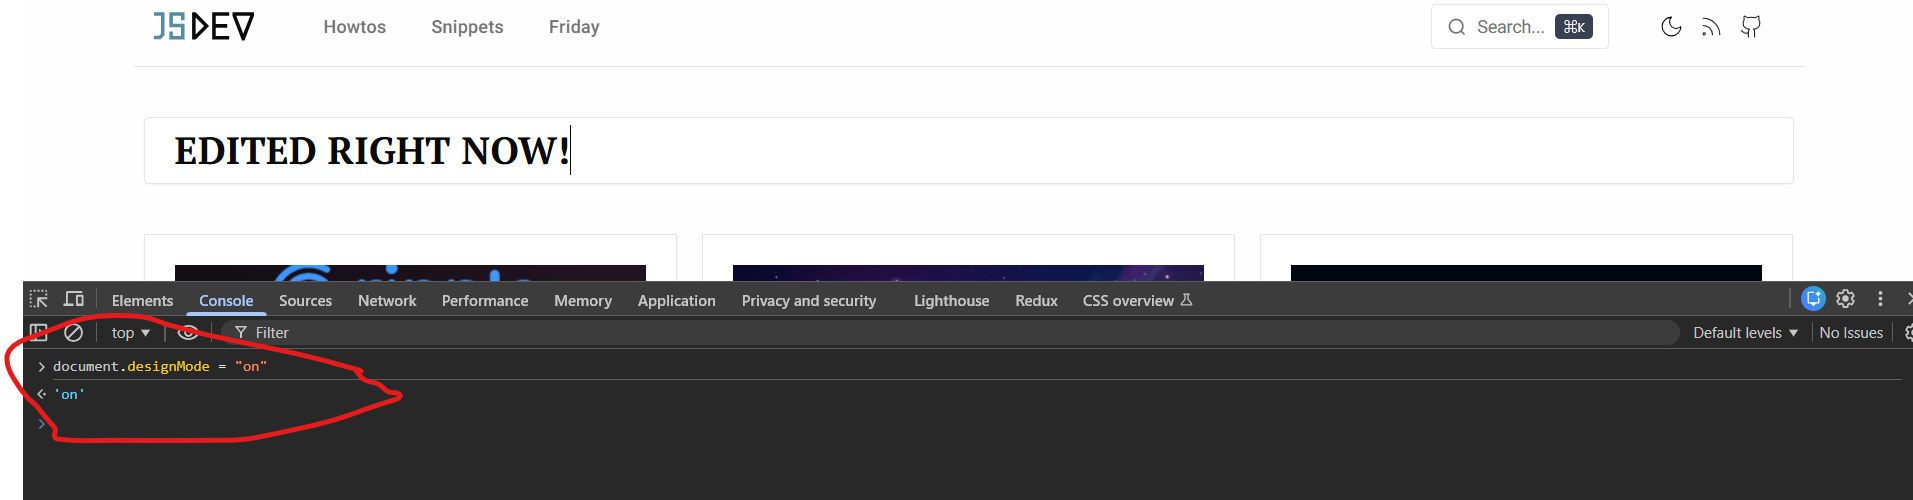
Use cases:
designers can modify text live
copywriters can adjust content without touching code
marketing teams can mock ad banners or hero sections
Surprisingly useful.
8 Quick Access to Inspected Elements
DevTools keeps a history of inspected elements:
$0— most recently selected$1— previous$2,$3,$4— earlier selections
Example:
$0.style.background = "purple"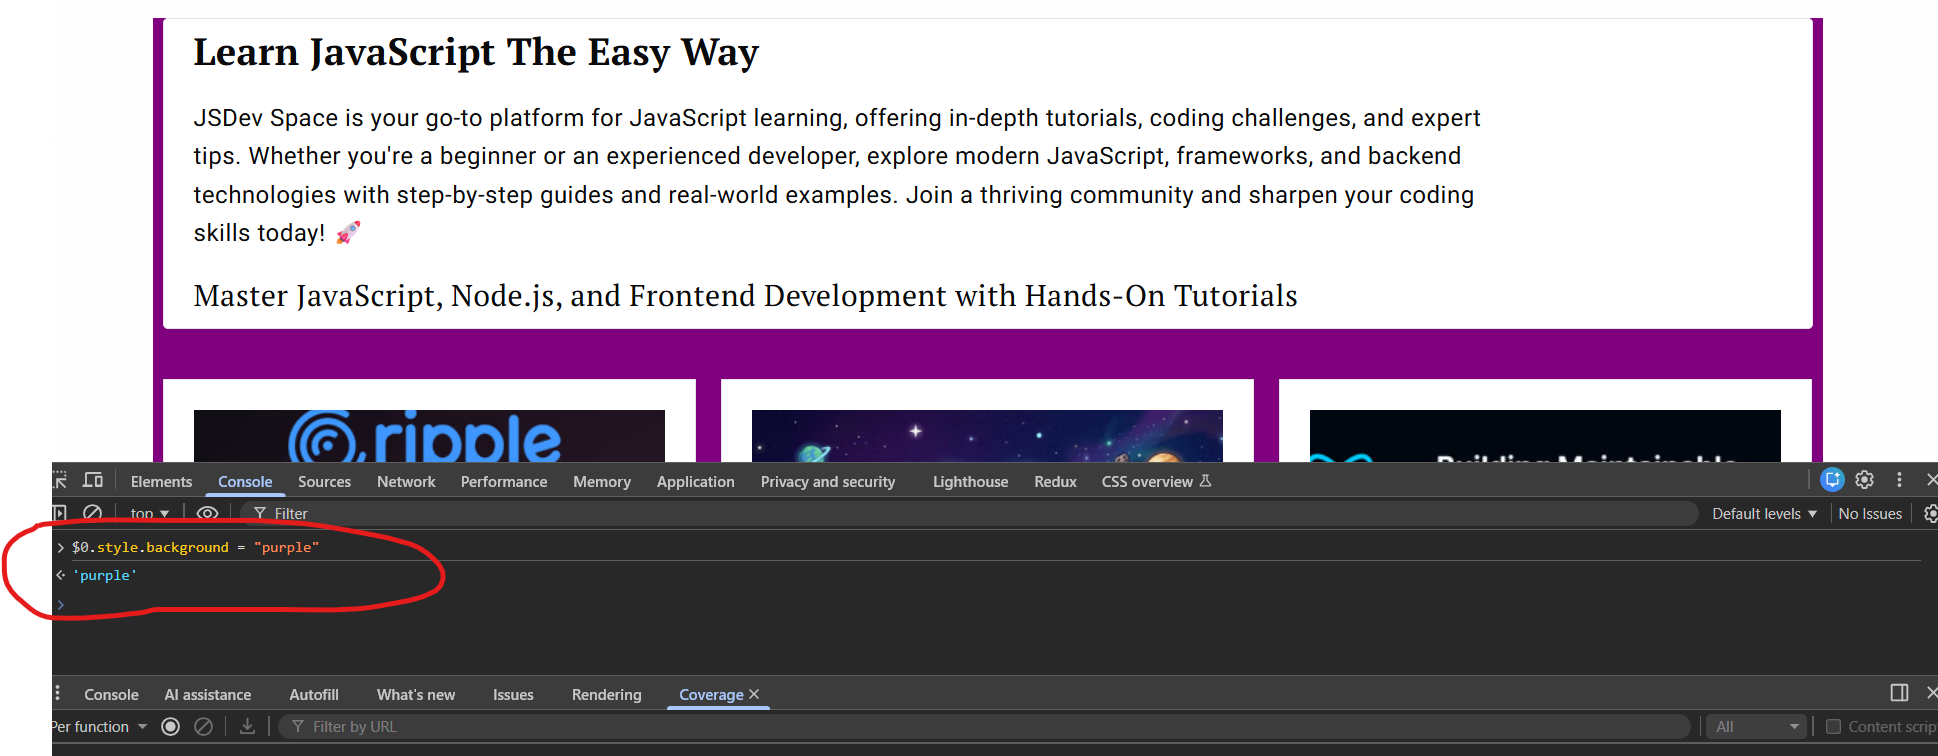
Great for quick tests instead of manual querySelector.
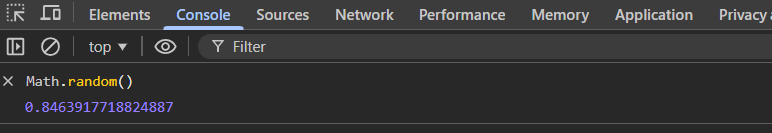
9 Live Expressions
Click the eye icon in the Console to create a Live Expression — a JS expression that evaluates every 250 ms.
Useful for watching:
variable changes
DOM state
timers
scroll positions
FPS metrics
Final Thoughts
Chrome DevTools contains far more capabilities than most developers regularly touch. This article showcased a handful of rarely discussed but extremely useful features.
If you want to go deeper, the official DevTools documentation is the best place to start.
Good luck and happy debugging.